First Step: Research & Exploration

Research is foundational to my process, rooted in atomic design principles and refined over time to meet evolving challenges. I explore the industry, organization, and user experience holistically—identifying gaps and opportunities through methods like surveys, contextual interviews, collaborative workshops, and (my favorite) whiteboarding sessions.
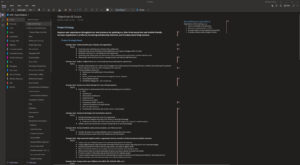
Coming into this project with little prior knowledge of harness racing, I quickly immersed myself, documenting insights as I uncovered the industry’s dynamics, stakeholder needs, and user pain points.
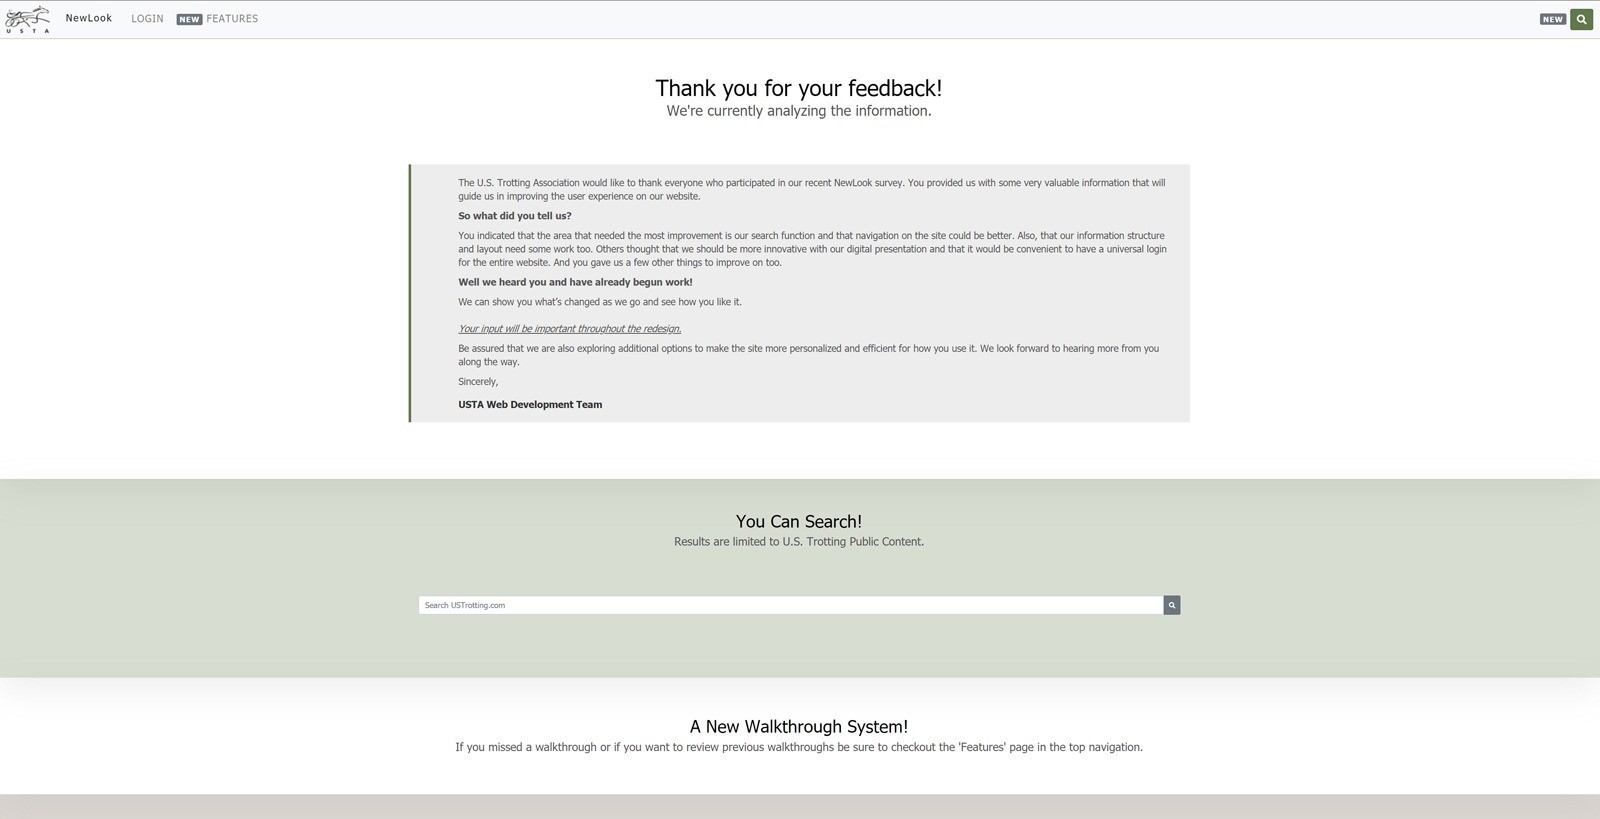
To avoid disrupting live membership portals, I partnered with web staff to launch a dedicated subdomain as the centralized hub for all redesign-related communications across the industry and membership.
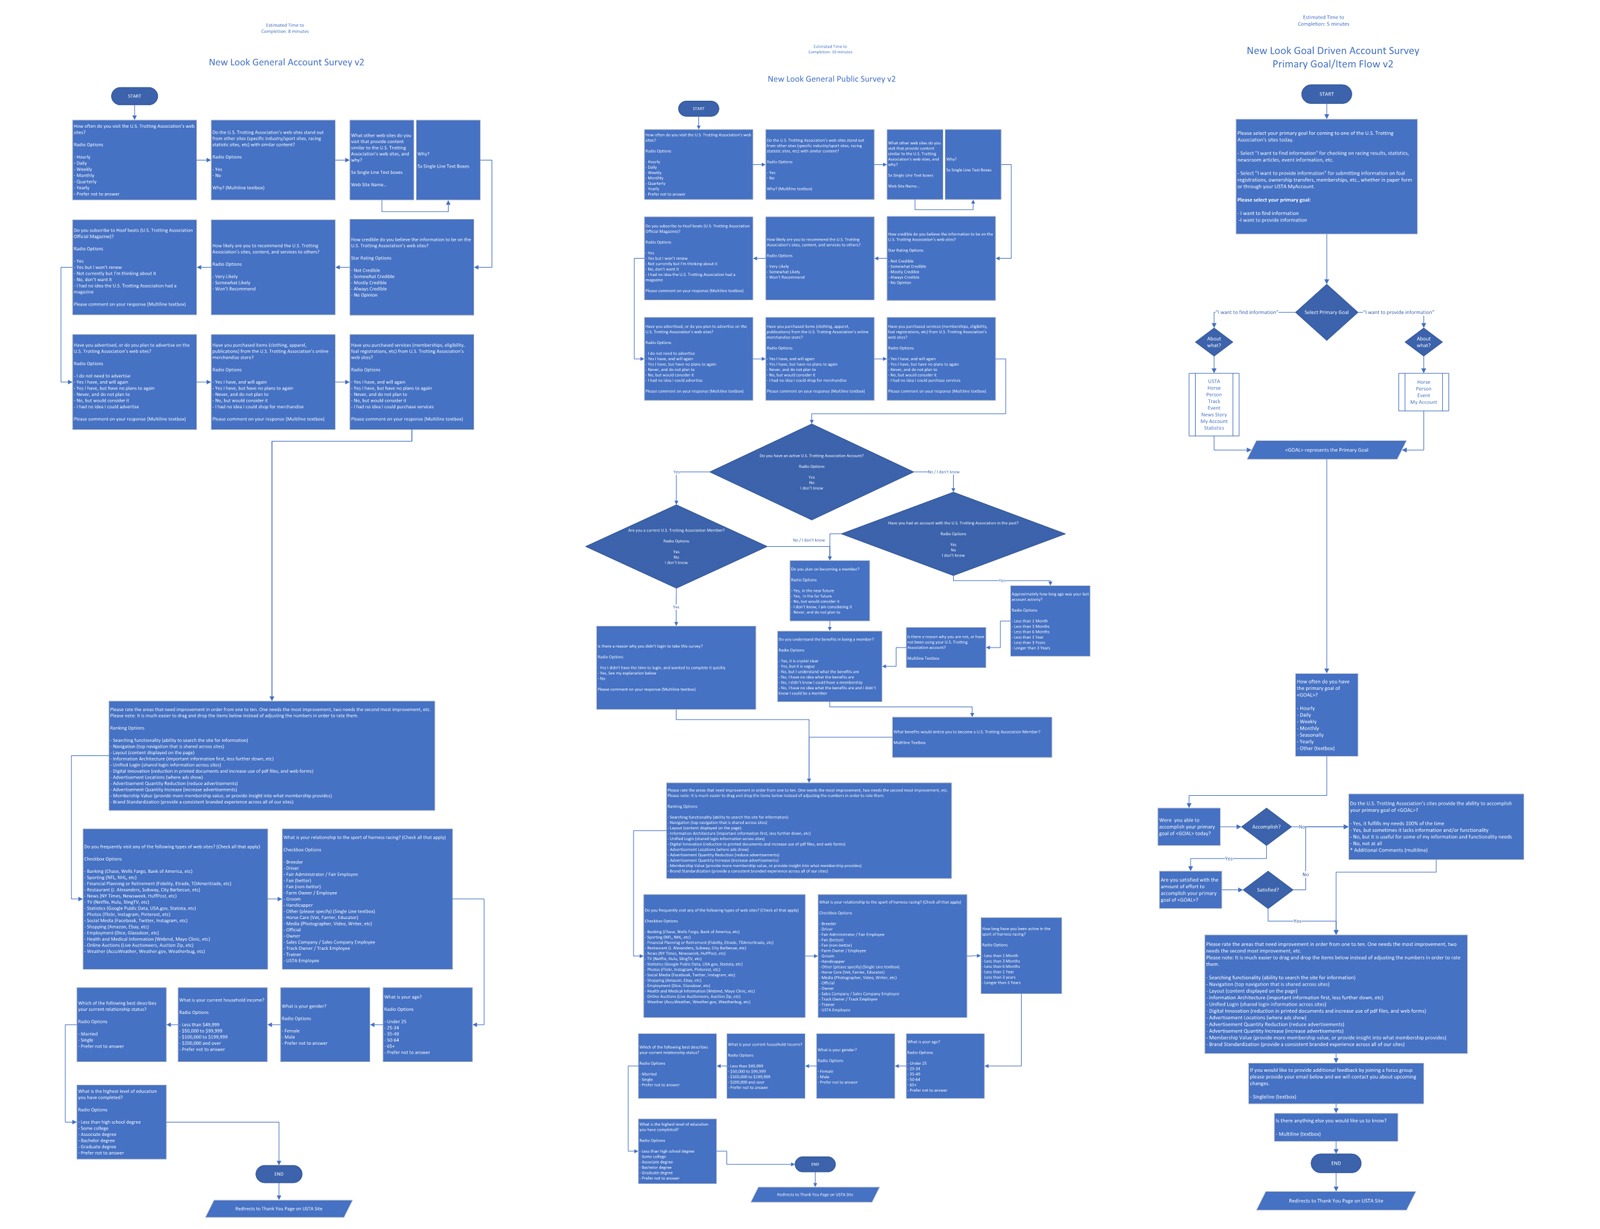
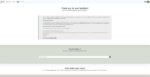
Once we committed to collecting project-specific user insights, I designed the approved survey flows and deployed them via SurveyMonkey to gather actionable data.
Objective Alignment
To ensure alignment with organizational objectives, I facilitated cross-functional meetings to clarify and define project goals. This unified departmental efforts and streamlined decision-making across the board.
Industry
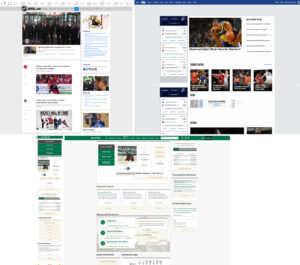
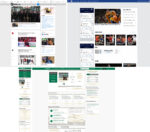
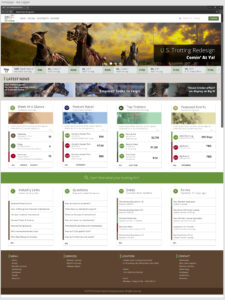
Early in the project, I analyzed data-rich platforms like the NHL and NFL to benchmark best practices in presenting complex statistics, exploring design strategies USTrotting could adapt to elevate its own data experience.
Organization
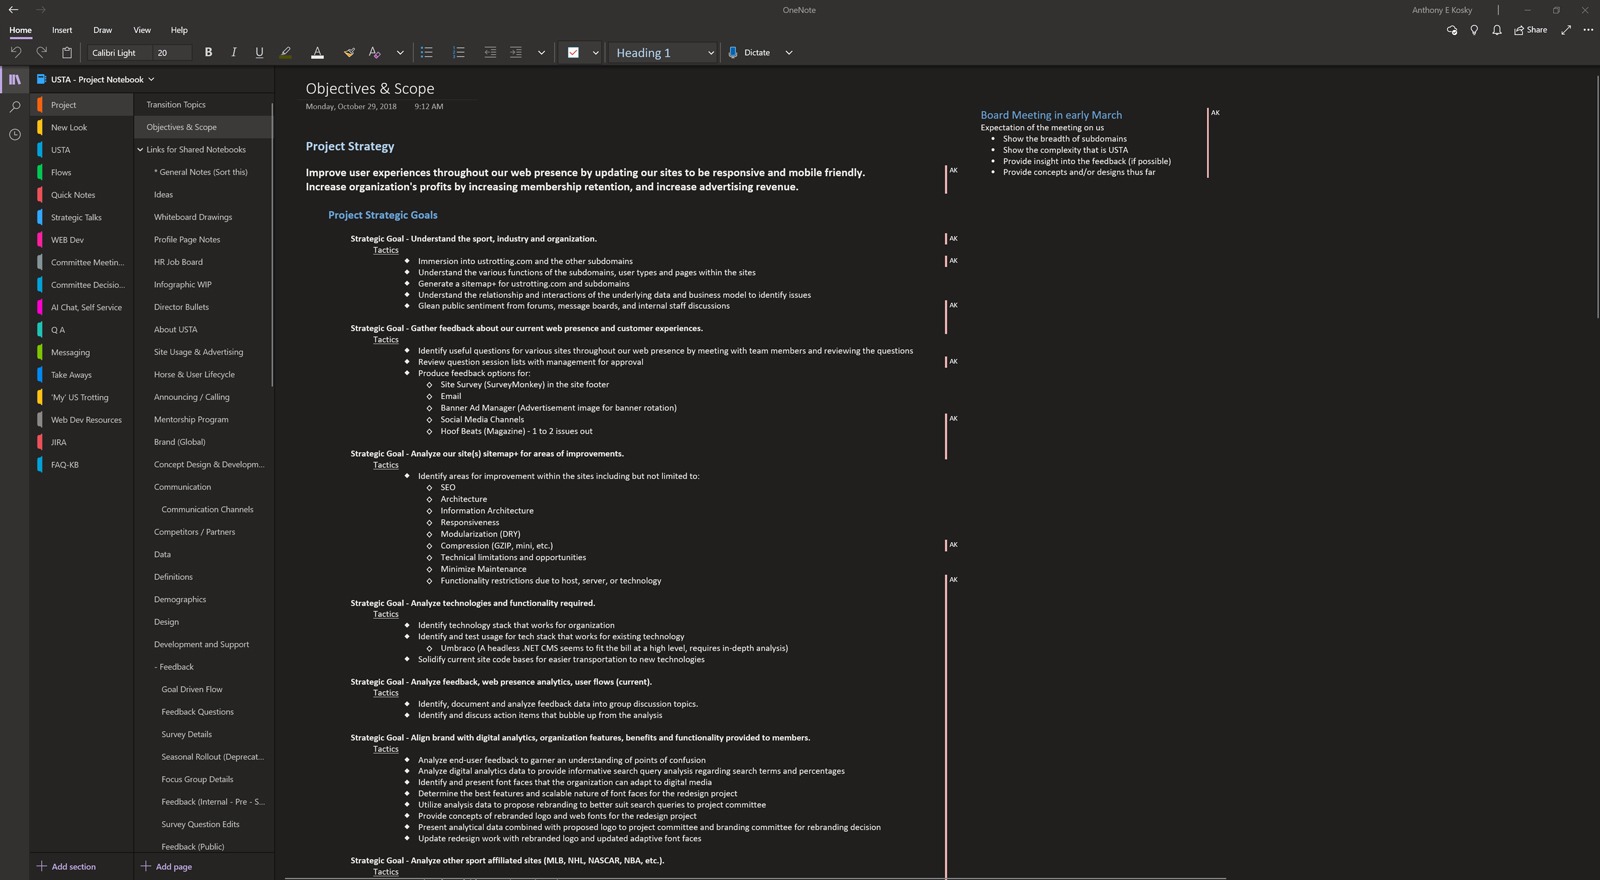
I conducted strategic interviews with department leads to uncover key organizational challenges and identify subject matter experts. Follow-up employee interviews revealed root causes of user-reported pain points and assessed current mitigation efforts, building a clear foundation for targeted design solutions.
Users
To generate targeted insights critical to project success, I analyzed legacy survey data, usability patterns, and analytics trends, then developed tailored surveys deployed via SurveyMonkey to fill remaining knowledge gaps.
Second Step: Data & Analysis
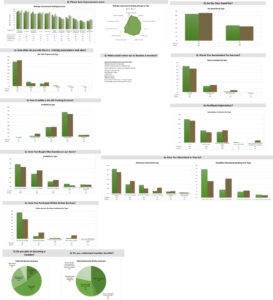


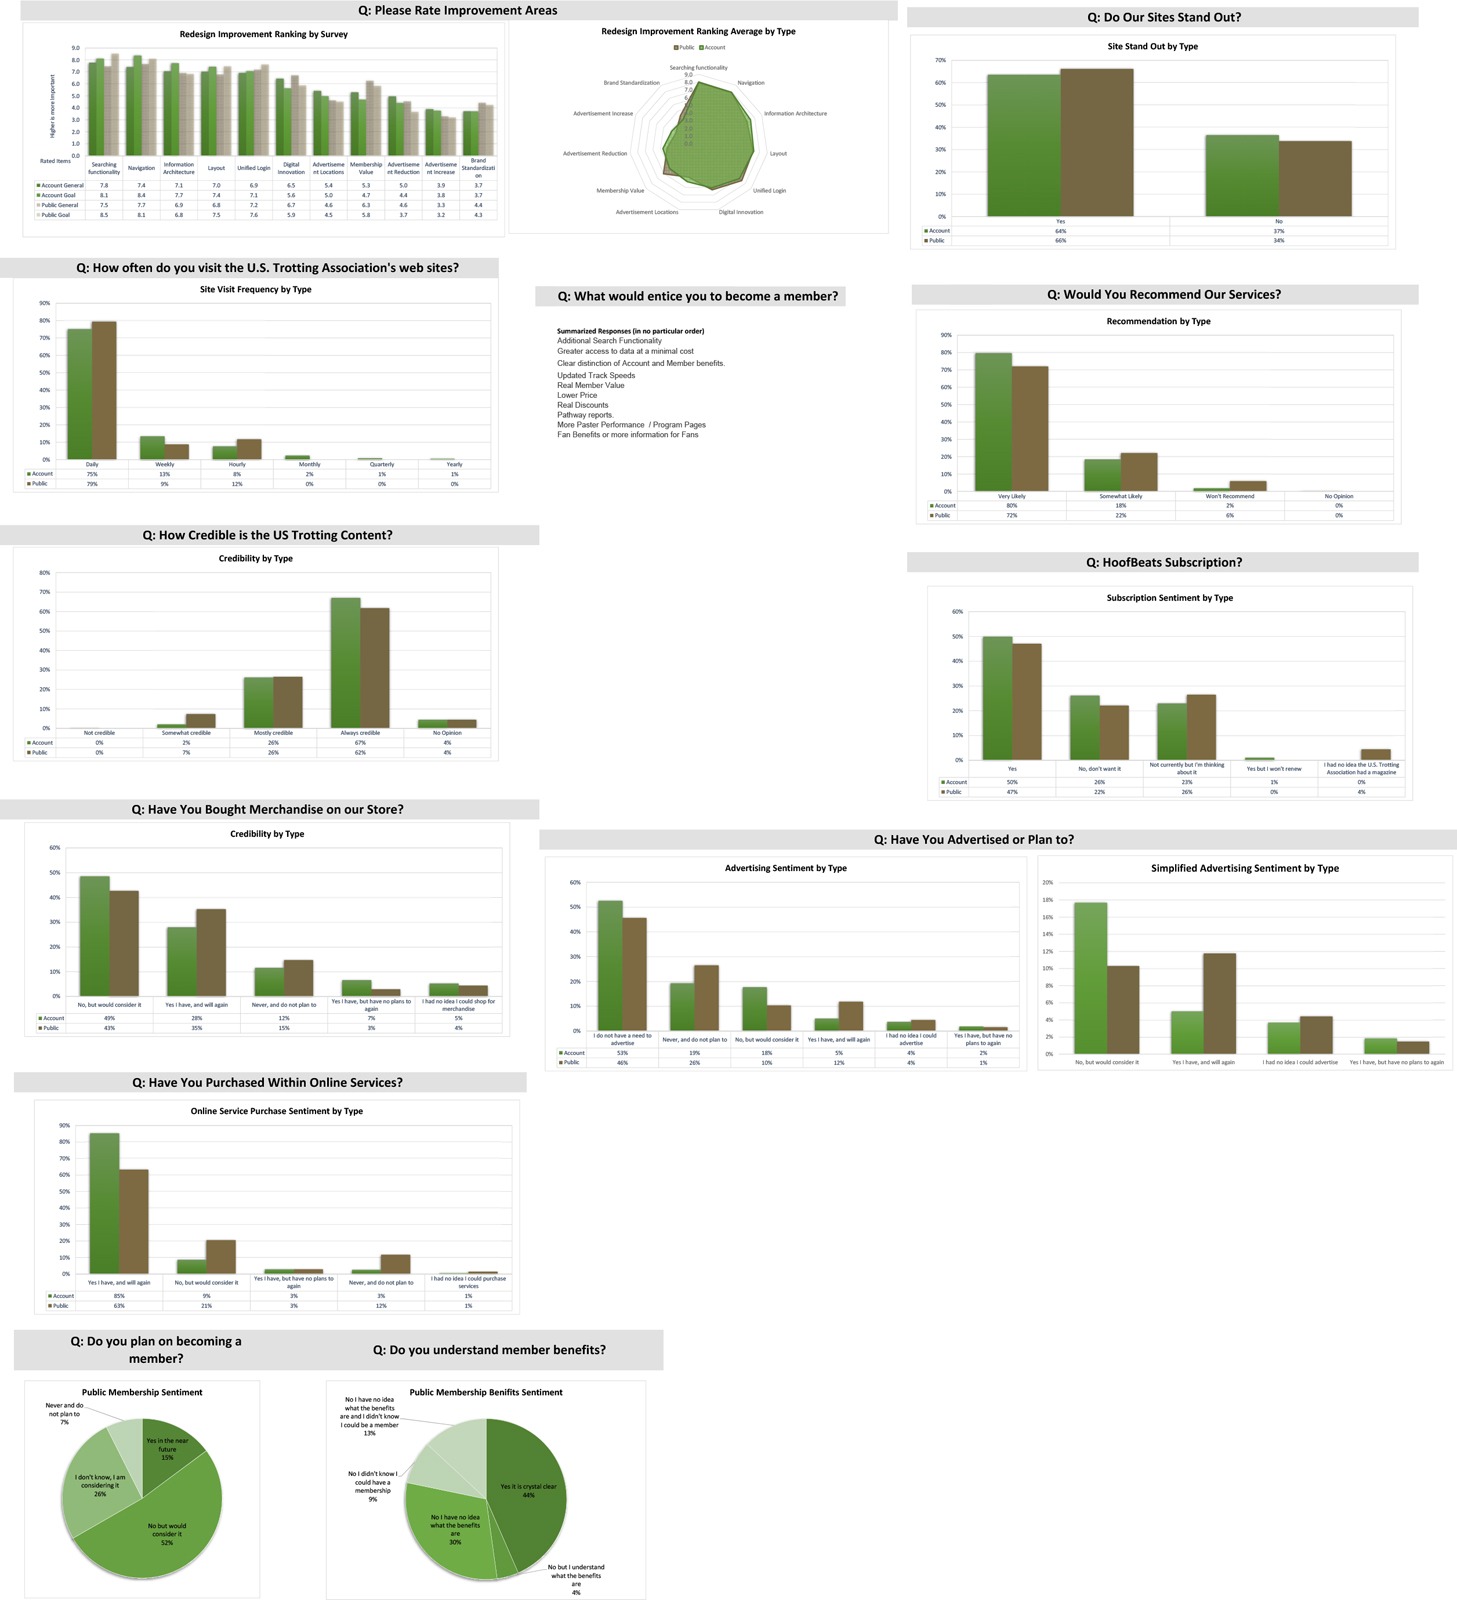


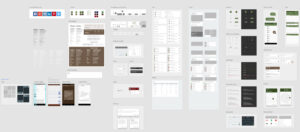
Data and analysis drive my design decisions by highlighting key issues and guiding collaboration. I built an Excel dashboard that unified survey responses into a clear, actionable view, combining qualitative and quantitative insights with prioritized action items to support leadership presentations and streamline decision-making.
Data and analysis drive my design decisions by highlighting key issues and guiding collaboration. I built an Excel dashboard that unified survey responses into a clear, actionable view, combining qualitative and quantitative insights with prioritized action items to support leadership presentations and streamline decision-making.
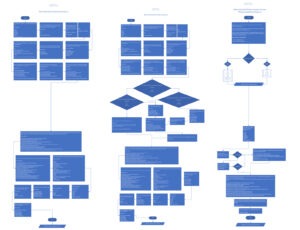
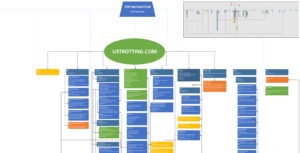
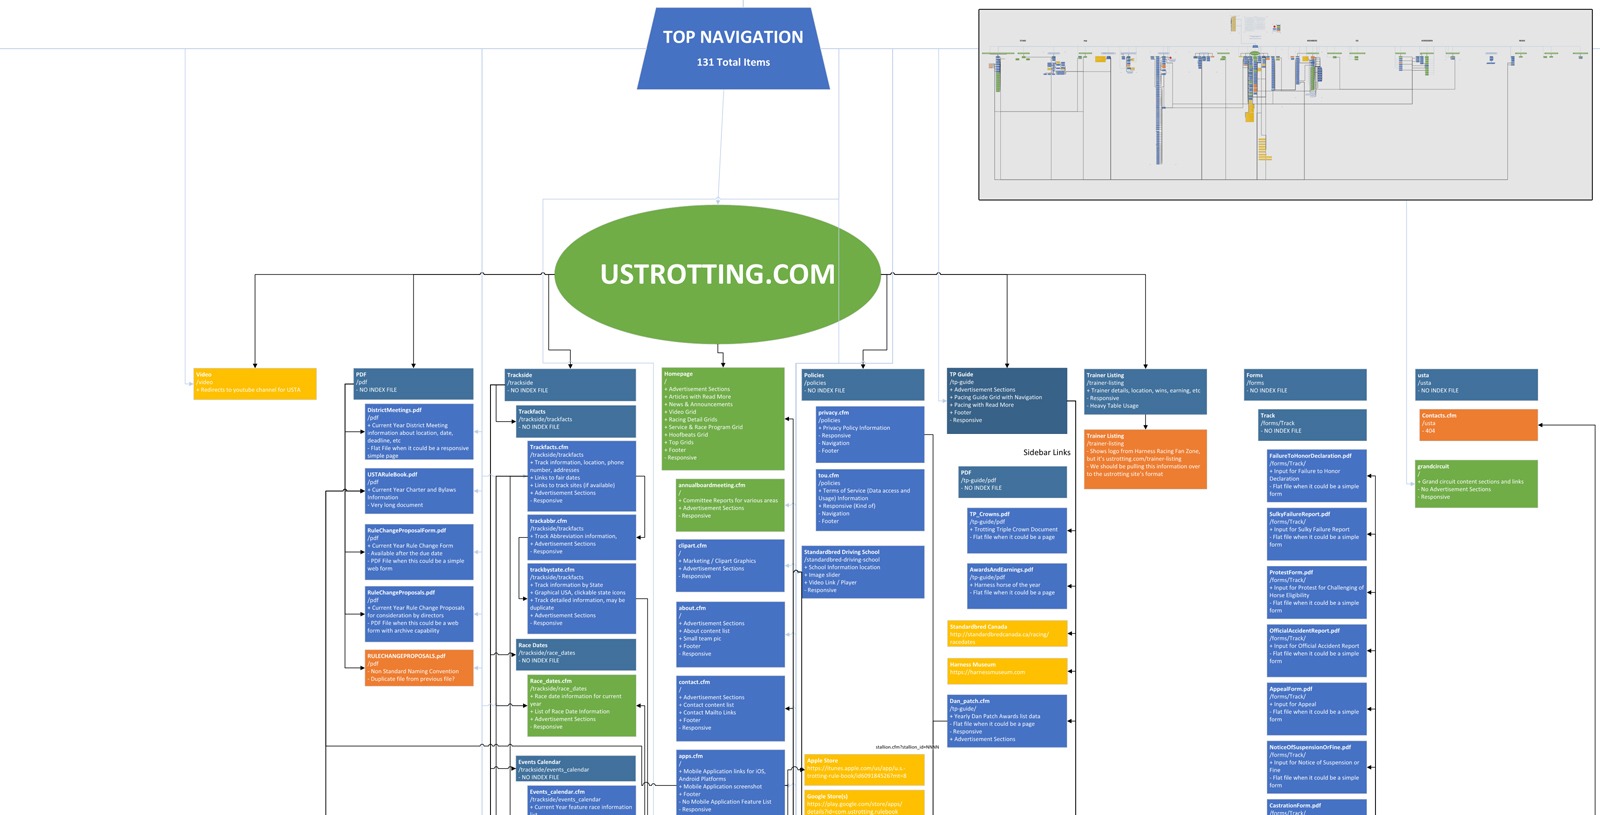
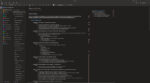
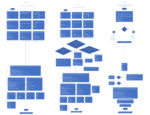
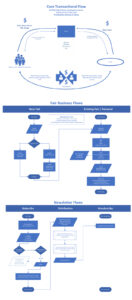
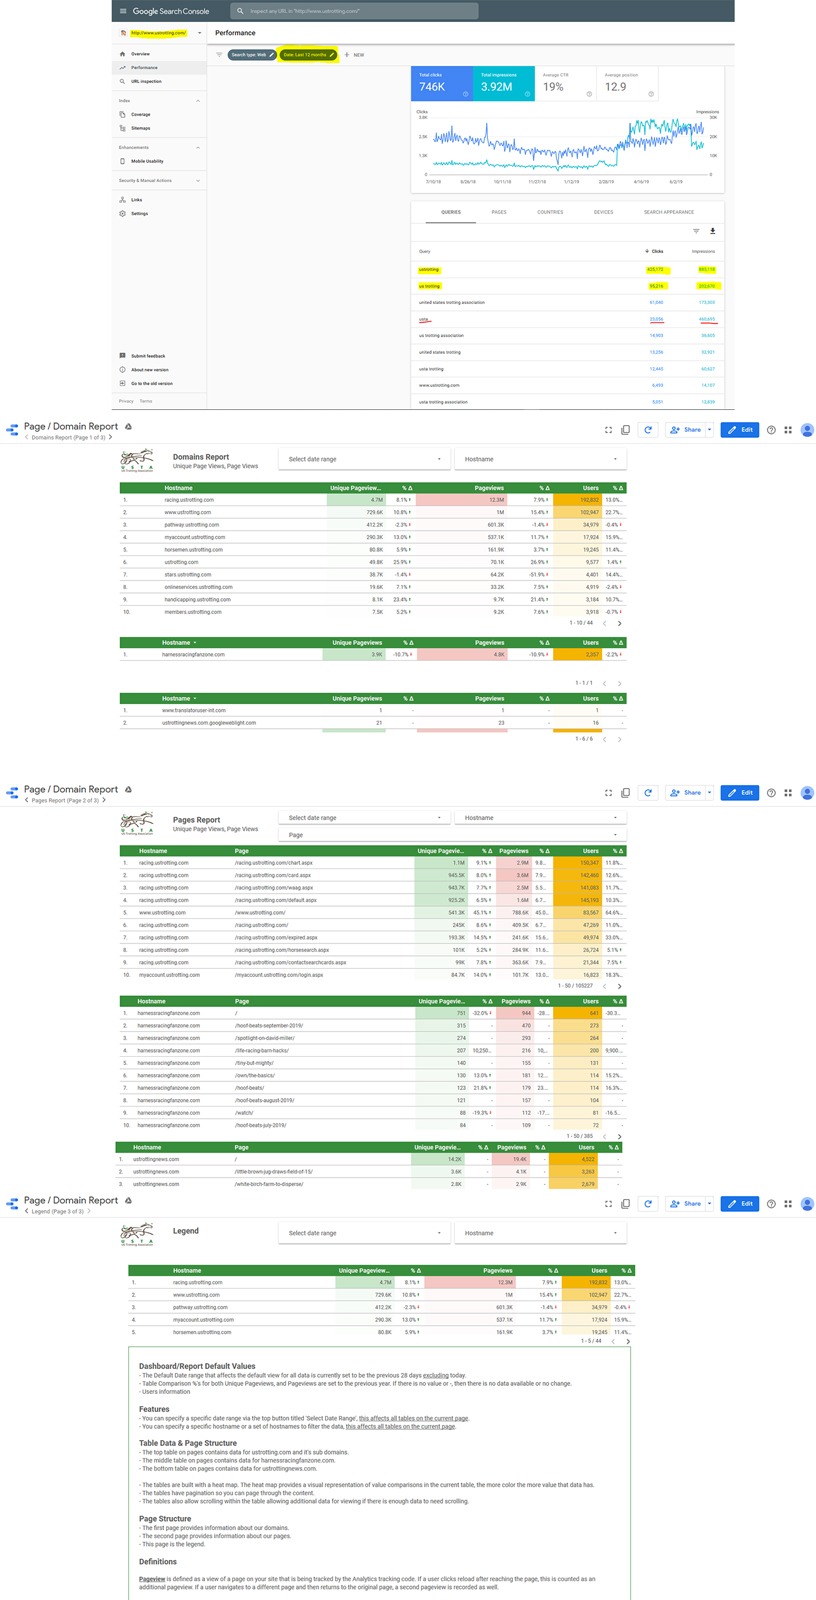
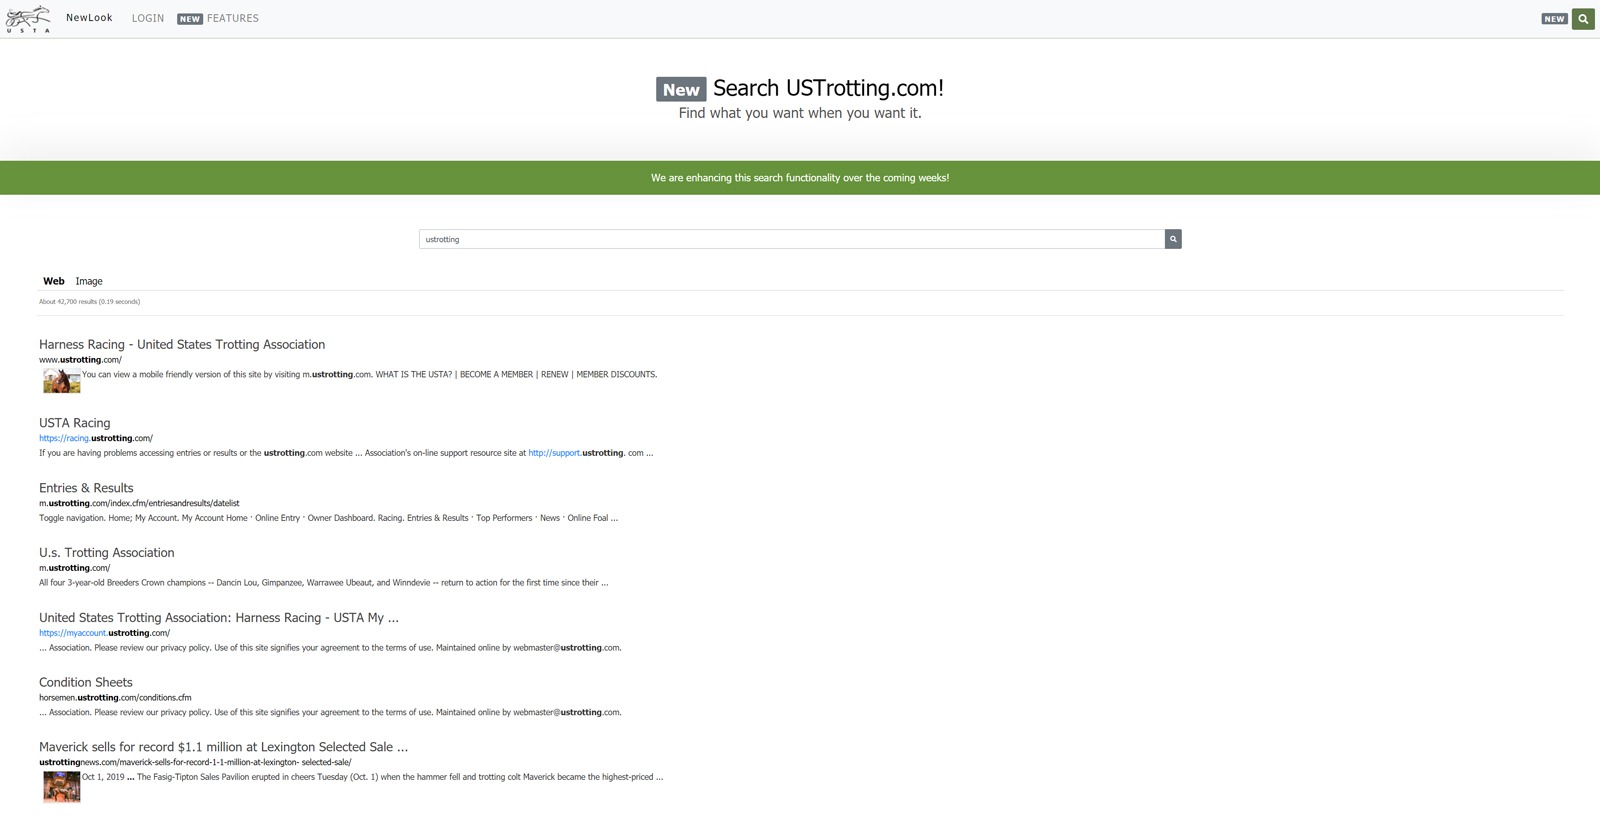
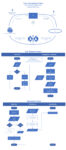
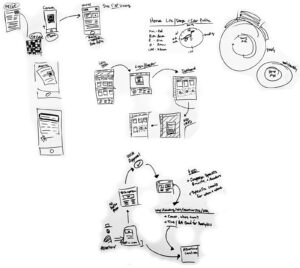
To enhance usability and streamline processes, I created business process flows that mapped everyday user interactions, driving productive discussions around optimizing experiences. I partnered with the web team to implement Google Custom Site Search on the project subdomain and led organizational demos to ensure adoption.
Search term analysis and survey feedback revealed brand confusion, prompting me to design and present new logo variations that successfully resolved the issue.
Learn More About This Case Study
USTrotting Phase 1 – Data & Analysis
USTrotting Case Study – Data & Analysis page defining the…
USTrotting Phase 2 – Ideation
USTrotting Case Study – Ideation page defining the work that…
USTrotting Phase 3 – Design
USTrotting Case Study – Design page defining the work that…
USTrotting Phase 4 – Develop
USTrotting Case Study – Design page defining the work that…